Buffer Overflow Attacks
I just spent a day playing with buffer overflow attacks on computer programs. I want to share my findings. At a lower level in computer operation, there is no concept of a character string or object to a computer. There is only data of varying sizes and memory where that data can be stored. As such, to represent an ASCII string, often an array of bytes is used. To achieve an array of bytes in this limited environment, the array exists as a pointer, which is a variable containing a number, that refers to the memory address of the first element in the array. The array is only a single dimension, unlike higher-level languages that introduce the concept of multi-dimensional arrays. Each array element is stored sequentially in a contiguous block of memory. The termination point in memory of such an array can be determined in different ways. You could store the length of the array in a separate variable. However, strings are generally NULL terminated, meaning that the last element in the byte array is of the value 0. When that is seen, it is treated as the end of the array. To handle a string in a program, a block of memory is allocated. The string is copied into it, manipulated as desired, and copied out of this block of memory, as needed. This block of memory is called a Buffer. They can be easily referenced by memory pointers such that many different parts of a program can refer to and work on the same data in memory. Buffers are a common feature in lower level languages, such as C, but if you work exclusively in higher level languages, the concept might be foreign to you. Buffer overflow attacks are a type of attack that exploits a bug in a program called a buffer overflow. Buffer overflows can occur when the data being worked on is not properly sanitized or when the size of such data, relative to the buffer size, is not properly managed. Typically, this kind of attack is targeting a buffer that is stored on The Stack.
For this project, I decided to create my own buffer overflow vulnerable program and attempt to exploit it. Because of the low-level nature of this kind of attack, some understanding of the underlying system architecture we are working with is required to exploit it. For the sake of this example, I am going to assume it is x86-64, running Linux, and the compiler is GCC. As I mentioned earlier, while it depends on the architectures implementation, on x86-64 the stack actually starts at the top and grows downward. So the memory address in the stack pointer, is less than the memory address in the base pointer. This also means that as you iterate through the elements of an array, stored on the stack, you are getting deeper into the stack. As such, you are getting closer to the end of your executing function’s stack frame and closer to the calling function’s stack frame. To start this project, I wrote a small program in C without buffer size checks. I deliberately sent it data that left it writing into memory past the end of the buffer. Here is my program: If you compile this program and run it with an argument, you should get the length of the argument (Not including the C string NULL terminator) and the location of the buffer in memory. Something like this: The program is only looking at that one first argument. The double quotes are important so that the string is treated as 1 whole argument. Normally, spaces ” ” mark the separations between arguments. This will come back up later. If I send it something longer than the length of the buffer, I can induce a problem. Here I send it 75 bytes worth of data, not including the null terminator. Remember, the buffer is only 50 bytes long. Here is the result: Here is the first hurdle that I ran into. I sent the program 75 bytes to write into the buffer. However, it is giving this strange error, “*** stack smashing detected ***”. It turns out that modern versions of GCC build programs, by default, with code embedded to check for overwriting of the stack. It may be possible to trick the system if you knew where the metaphorical trip wires were and didn’t touch them. But normally, you aren’t going to have that much control over a target program. For the sake of this experiment, I just disabled the protections and recompiled my program. Use the “-fno-stack-protector” option in GCC to do this: Alright, that is different. I am getting a segmentation fault. A segmentation fault occurs when a program tries to access memory addresses that it doesn’t have access to. I believe, specifically, it is memory pages that the program does not have assigned to it. This triggers a hardware exception in the CPU during execution and causes a context switch to kernel space so that the kernel can handle the error. In this case, it was not a recoverable error. Clearly, there is a problem with our program and therefore, it was simply killed. However, segmentation faults are not always unrecoverable or a sign of a bug. These are actuality to be expected if you are using swap space or as Microsoft Windows likes to call it, paging. Generally, if you have swap setup and enabled, and if your system is using more RAM than it has available, it can move low-priority pages of system memory to disk. When a program then tries to access memory on a page that has been swapped to disk, it will trigger a segmentation-fault. A context switch to the kernel is then made, but in this case, the kernel can then locate another page of low-priority system memory, move it to disk, reload the page that the program is trying to access back into system memory, reassign it that page in virtual address space, and resume the program. Swapping is clearly very slow and very hard on drives, but is sometimes necessary if not enough system memory is available. Anyway, getting back to the problem at hand, what is interesting about the segmentation fault(segfault for short) is that it occurs after the printf functions are executed. This much is obvious, given that we can see the output from the printfs. Clearly, the segfault did not occur when the buffer was being written out. However, there is nothing in the program after the printf calls, except a simple return statement. This kind of failure/bug, I can see very easily tripping up new C programmers. Because, if you are trying to debug this with print statements, you will find that the code executes perfectly fine and no segfault occurs until after your code is finished. The problem is that the code has overwritten data on the stack that it shouldn’t have. Specifically, it has overwritten the return address that the CPU should jump to when the function returns. Think about this, in C, you can call a function from anywhere inside another function. And ultimately, the program is just CPU instructions being executed one at a time, one after another, through the program. When a function is called, the CPU will have to jump execution to the location of the first program instruction of that function. However, how does it know where to jump to when that function returns? This is why the return memory address is pushed onto the stack, just before the jump occurs. When the function returns, that location is popped back off the stack and execution jumps to and resumes at that point. What is happening in this example is that this return address, in the previous function’s stack frame, is being overwritten by our oversized string. So when the main function returns, it tries to jump to a gibberish address. What I needed to do is figure out what the exact offset was between the return address in the previous the stack frame and the address of my program’s buffer on the stack. That way, we can calculate where we need to put the address to our payload. The easiest way to do this is to use gdb, The GNU debugger. Here is how I did that: Basically, all that I did was to pause execution right before the function returned. I printed out the contents in memory around where the base pointer register was pointing. GDB only printed 4 bytes at a time. I then stepped through the program one instruction at a time until the CPU instruction pointer register pointed at an address that matched one from the memory dump. There is a lot of output but the key pieces of information are:
Now we can subtract 0x7fffffffdb60 from 0x7fffffffdba8. That gives us our offset of 0x48 or 72 bytes. There is another problem that you may have noticed. If you look at the address of the buffer, as printed each time my program is run, you will notice that the value is different every time. First, it was 0x7ffd74ebed20. Then, it was 0x7ffd735ab360. Lastly, inside of gdb, it was 0x7fffffffdb60. This is a big problem because I need to jump execution of the program to the address of the buffer, where I will inject my payload. But if the address is constantly changing, I won’t be able to reliably predict where I need to jump to. The reason for this constant change is actually another security feature. The Linux kernel is randomizing the base address of the stack in virtual memory before each instance of the program is run. To check the status of this feature, run on your system: On my system, it had a default setting of “2”. To disable it on your system, with super user privileges, run: Now, each time the program is run, the reported buffer address should be fairly constant. Although, it does still seem to change slightly every now and then. I am not sure why that is, it could be interesting to look into later. I also found that the buffer address varied depending on whether I was running the program inside of gdb or not. I just made a note to keep an eye on it. Now, I will discuss my payload. For this, I will invoke the Linux kernel system call, exec, more technically referred to as sys_execve. This will allow me to replace the running program with a program of my choosing. I will give myself a Bash shell using path “/bin/bash”. This program needs to be as minimal as possible. I am working inside the confines of how I can exploit this buffer overflow and it needs to fit into the buffer. Therefore, I will write this payload in Assembly. I will use the ATT/GAS dialect since it is standard for GNU tools and I think more robust than the Intel dialect. However, it is generally considered to not be very intuitive. There is one more problem as well. If you were reading my comments from my C program, you may have noticed I said that C string NULL termination would be a problem. The issue is that any data that I want to pass to the buffer overflow vulnerable program as a command-line argument can have any byte value you want except for 0. If the data contains a 0, it is considered the end of the string and no further information will be passed into that element of argv in our program. So the payload program can not contain any bytes with a value of 0. I do like a challenge. Haha. So, here is my solution in GAS x86-64 assembly: In testing, I found that using the MOV instruction to assign immediate values to registers would encode the immediate with it’s length of at least 16 bits. For this reason, I could not use MOV to zero registers. It would pad the bit length with 0s and cause bytes with values of 0 in the program. To zero the registers, I XOR(Exclusive OR) them against themselves. If I want to assign small values, less than 256, to registers, then after the XOR operation, I add to it with the ADD operation. It seems that immediates can be encoded with ADD without additional zero bytes. I do, at one point, use MOV to assign a full 64 bit value to a register. However, no zero padding bytes are needed for that. To assemble the program in a raw binary form simply run these 2 commands: To then disassemble and verify the binary, you can run: The next step that I took is to hexdump the binary in canonical mode: As you can see, there are no zero bytes. Now I need to write those bytes as \x?? delimited text so it can be passed via command line. This conversion can be done easily with a few regex powered find and replaces in a text editor. Here is the result: I will refer to this delimited text, that is to be converted into bytes, and passed into the buffer, as the Code Text”. If you run: payload_binary.bin will be identical to buffer_overflow_payload.bin My assembly payload program pushes 16 bytes of data onto the stack. This addition will start to occur at the memory location where the function return address was. Effectively, the payload will run as if it is the continuation of the function that called main. So it’s stack frame and stack pointer are inherited from that. The return address is 8 bytes by itself. To avoid clobbering my own program, I need to pad 8 more bytes between my program and the return address. I simple pad bytes with the value of 0x90. So the Code Text becomes: My assembled payload program was 37 bytes long. After adding the padding, the Code Text now represents 45 bytes. Remember that the offset I calculated earlier was 72 bytes long. That means that I need to pad out an additional 27 bytes. For this, I will create a NOP(No Op) sled. A NOP, is an x86 CPU instruction that does nothing. It just goes to the next instruction. It is a single byte long and has a value of 0x90. In the event that the injected address to my payload is off by a few bytes, as long as it lands in the NOP sled, it will execute down the sled of NOPs until it begins executing my payload program. After doing that, the Code Text becomes this: That is 27 “\x90″s, the bytes of my assembled program as delimited text, and 8 more padding bytes. It should represent a byte length of 72 bytes. The last thing to do is append the address where the buffer will reside in memory. Assuming that the address bring printed by the program is 0x7fffffffdb60, I could use that. However, since I have the 27 byte NOP sled, I might as well use it. I will add 13(0xd) bytes to the address, to target the center of the NOP sled. Lastly, since x86-64 is Little-Endian, the byte order of the address must be reversed. So after appending that, the finished version of the Code Text becomes: If you are recreating this for yourself, don’t forget to adjust that last address depending on your buffer address. You also may notice that the address that I entered is only 6 bytes long. This is because most current 64-bit implementations are cheating and only using 48-bits to cut complexity and cost. That still comes out to over 281 terabytes of addressable space and should keep the world well-served for quite some time. And because the CPU is little-endian, the bytes are written in reverse order, so I still don’t have to worry about adding zero bytes to the most significant place values. So the Code Text is still not broken and can still be passed via command line parameters. Finally, we can attempt to exploit the buffer overflow. Even though the above example does not contain the ASCII code for a space, 0x20, I recommend enclosing your command line argument in quotes, just in case. Here it is: WAIT! WHAT? The reason for the segfault is that there is one more security feature blocking the exploit. Remember that what I said earlier about the stack and machine code being in 2 different places? Well the virtual pages containing the stack actually have their own permission settings. In this case, they can be read or written to, but not executed. To have them be setup with execute permissions, you must link the program with stack execution enabled. This can be done by building the program like this: Now I retry it: And there it is. A buffer overflow successfully exploited. It only took 3 different security features to be disabled, including one in the kernel. And that is with a program written specifically for exploitation. This program actively prints out information to assist with it’s own exploitation and I wrote it in such a way to keep other variables off the local function stack so that they would still work reliably an not get in the way. I learned a lot from this project, but I also don’t feel nearly as worried about these kinds of buffer overflow attacks in the modern era. There are many layers of security in place to stop it. And that assumes that there is a buffer overflow vulnerability existing in the software to start with. If you were following along and disabled the kernel mitigation, don’t forget to re-enable it when you are done.
|
||
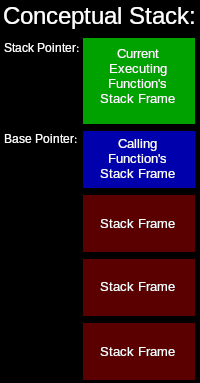 The stack is a common low-level memory structure. It is a first in, last out type of storage system. It is typically used to store the local variables and parameters of functions. This is how functions can call other functions or themselves. When a function is called, the function’s local variables are pushed onto the stack, into what is called a stack frame. Each function has its own stack frame. The start of the current stack frame is tracked by what is called the base pointer. The end of the current stack frame is tracked by what is called the stack pointer. The actual machine code of the function is stored separately in memory. The local variables of the function are referenced by the executing instructions via offsets from the base or stack pointers. The current stack frame is always at the top of the stack, so the stack pointer points to the end, or top of the stack. When I say, “top” of the stack, I am referring to a stack that grows from the bottom-up, as things are added(pushed) onto the stack. In most implementations, though, stacks grow downward. More on that later.